MISSION
Focal areas
In the media
Featured PUBlications
Related news
Geographic information about biodiversity is vital for understanding the many services nature provides and their potential changes, yet remains unreliable and often insufficient. Built on a scalable web platform geared for large biodiversity and environmental data, Map of Life endeavors to provide ‘best-possible’ species distribution information and species lists for any geographic area.

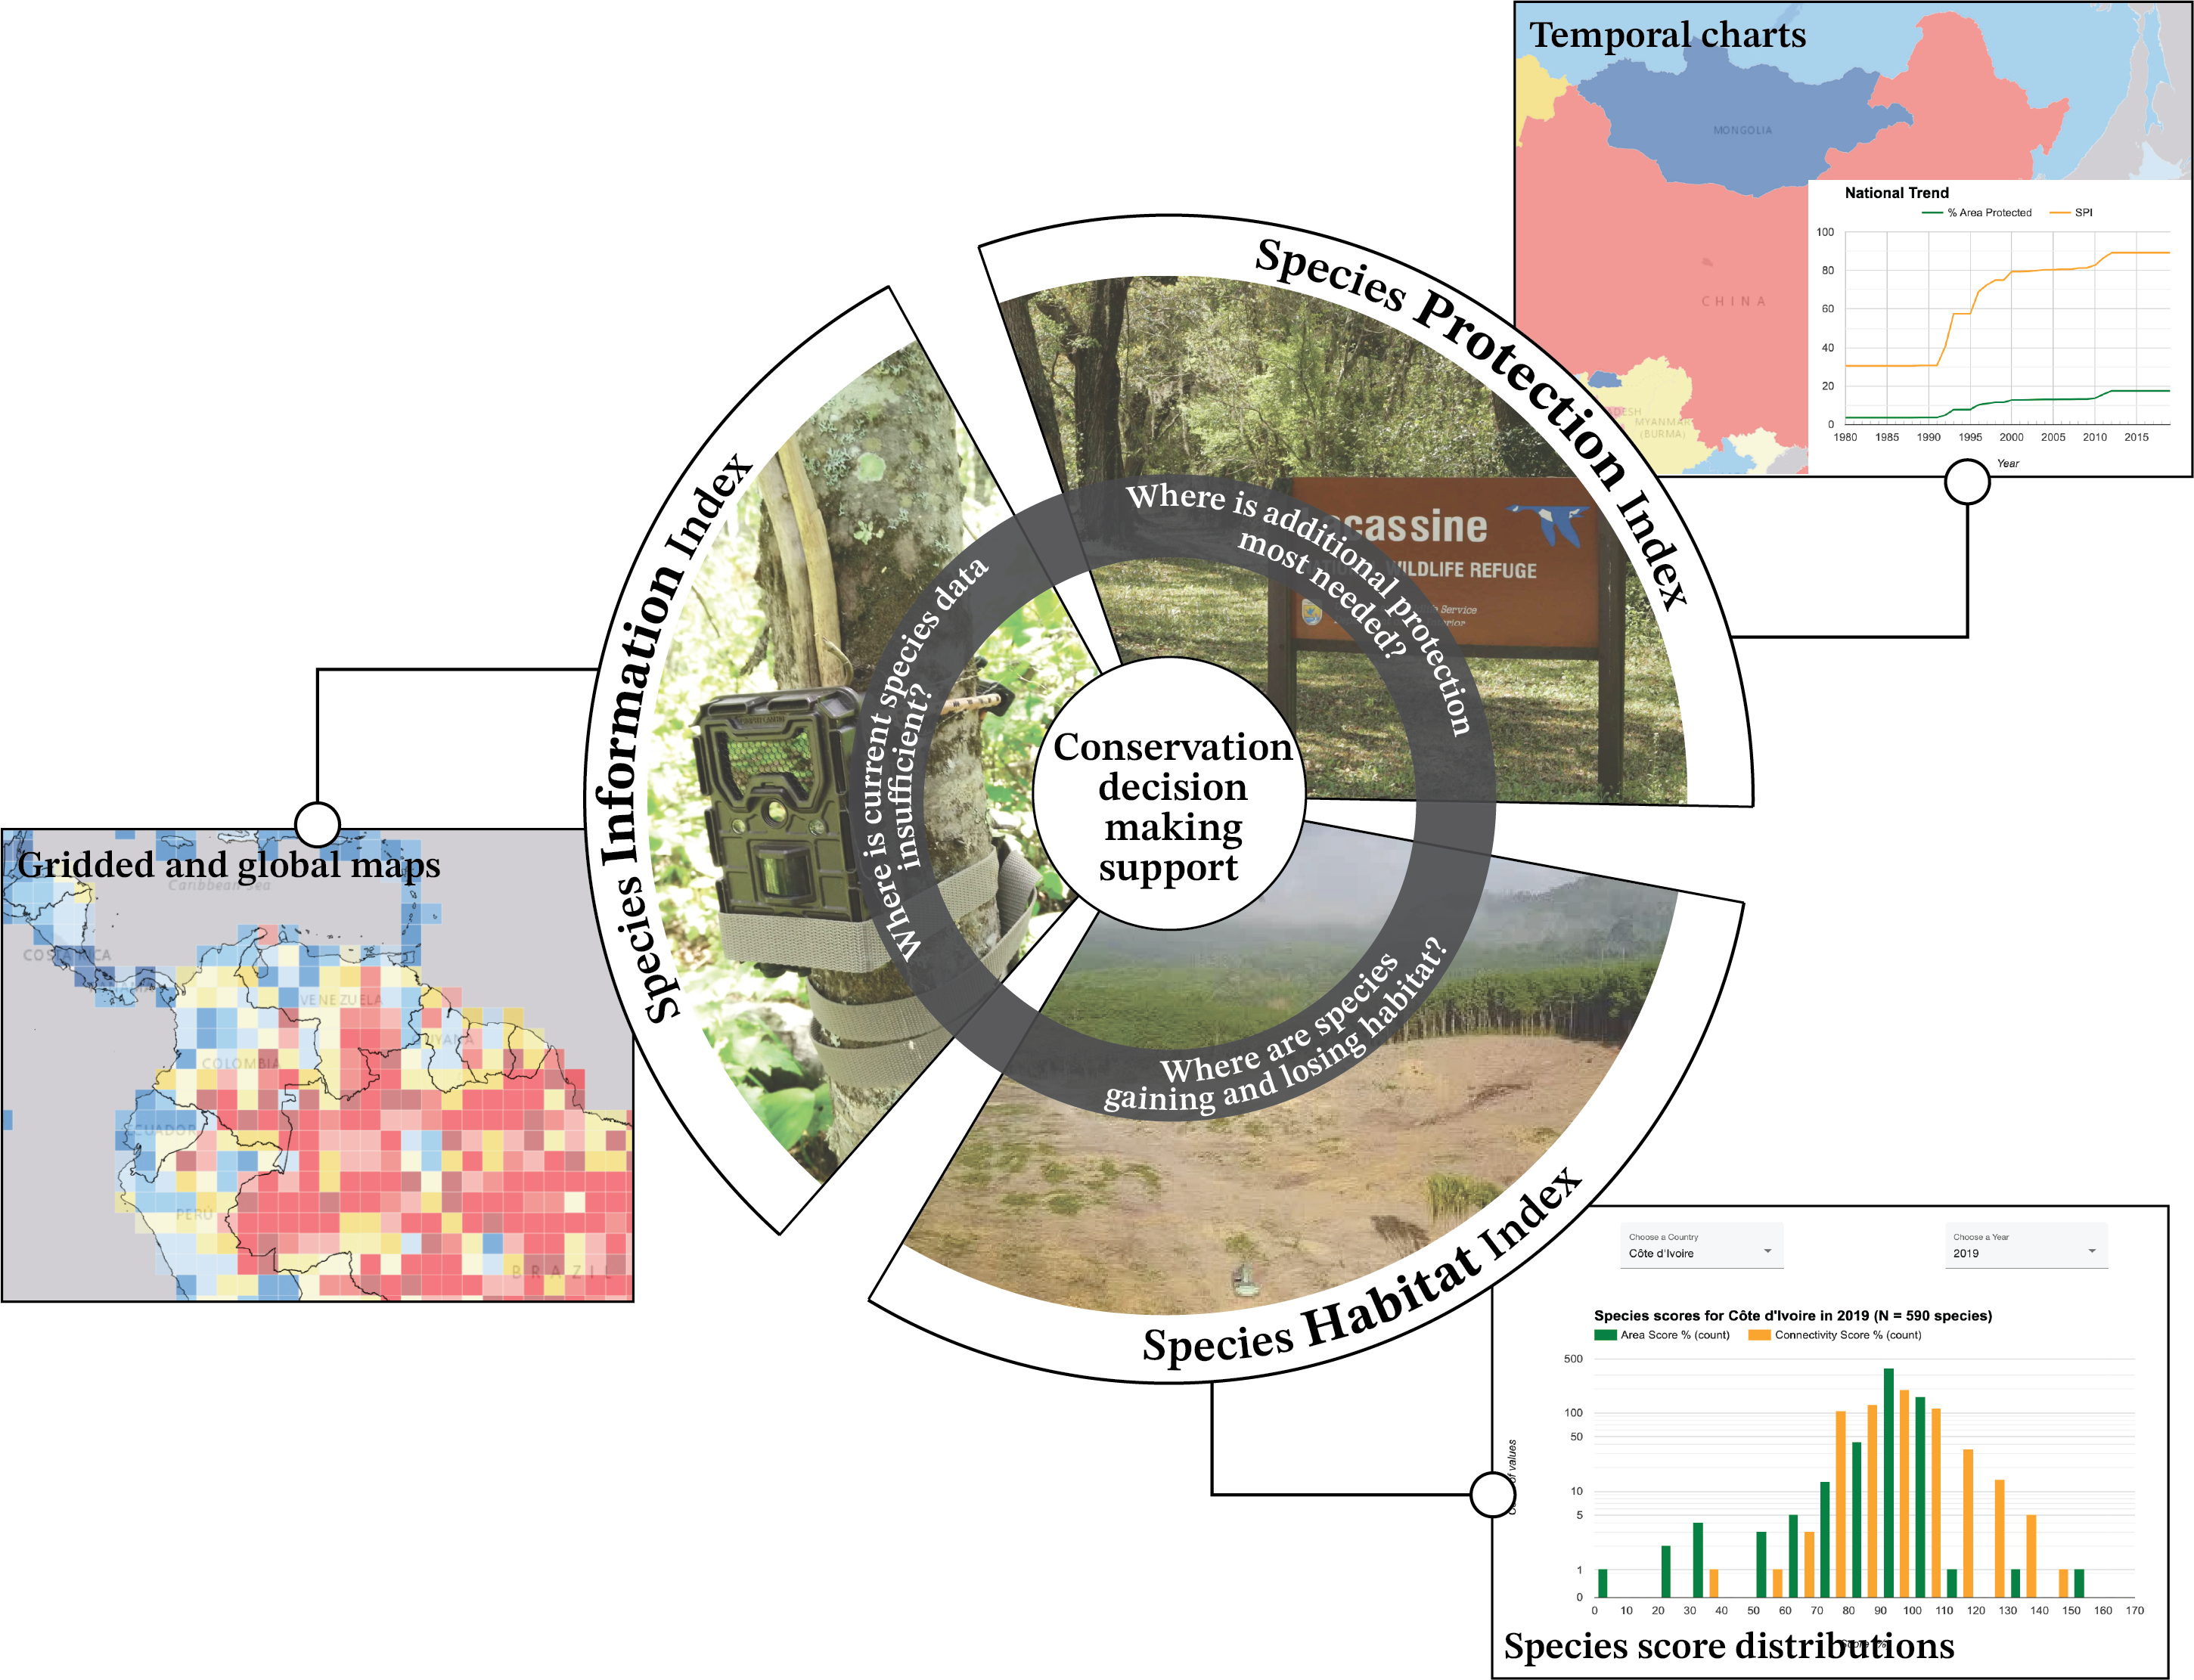
Map of Life, the flagship initiative of the BGC, aims to support effective and global biodiversity education, monitoring, research and decision-making by assembling and integrating a wide range of knowledge about species distributions and their dynamics over time.
Little Blue Heron
Egretta caerulea
Asiatic Softshell Turtle
Pelodiscus sinensis
Strawberry Poison Frog
Oophaga pumilio
Integrating a wide
variety of species data
From thousands of
unique global datasets
To generate localized
species expectations
And calculate national
conservation metrics

Focal Areas

Click through the main focal areas of Map of Life below to learn more about the platform and initiative.

Biodiversity Data Science

Screen recording of an example Species Page on MOL.org. The gif shows a sidebar of map layers on the left and a map on the right showing east Africa. Several layers of distributional data for the example species are turned on and appear on the map.
Curating, cleaning, and compiling global biodiversity data
We ingest biodiversity data from varied sources, which we clean and harmonize to a set taxonomic standard, then mobilize following FAIR data sharing principles. This is the foundation of Map of Life - using these data, we produce high resolution species projections and analytics which are visualized on accessible, informative dashboards.

Species distributions

A species distribution model showing the predicted likelihood of a particular species' occurrence throughout Northwestern North America.
High resolution (1-kilometer) global species distribution models
We are producing a suite of high-resolution (~1 km2) standardized species distribution models for vertebrates, invertebrates, and plants. These models are particularly useful for conservation decision-makers, trend analyses, and as a benchmark for further species distribution modeling development. These models are well suited to support 30x30 conservation decision-making.

Biodiversity Indicators

Screenshot of an example Species Page on MOL.org for the Red Crowned Crane. The left sidebar shows a graph of habitat suitable range area for this species over time and the map shows areas of habitat loss and gain within the species suitable range.
Conservation metrics: from single species to national aggregates
Supported by the infrastructure and biodiversity data of the Map of Life platform, we maintain annually-updated biodiversity indicators – the Species Habitat, Protection, and Information Indices – for thousands of vertebrate species around the world, and we provide national-level reporting for all countries by aggregating these species level scores. Our indicators have been formally adopted by the Global Biodiversity Monitoring Framework. Indicator computation is supported by Essential Biodiversity Variables (EBVs) which are measurements of biodiversity at scales relevant decision making.

Conservation Prioritization

A map focused around the Great Lakes region in North America with a conservation priority map layer displayed.
Spatial, species-based conservation prioritization
We integrate the biodiversity data from the Map of Life with other environmental and socioeconomic factors to provide cost-effective conservation strategies through a high-resolution prioritization approach, which protects species from potential threats while minimizing the financial cost and land required for biodiversity conservation. Our approach also incorporates other ecosystem services benefits and diverse cultural values to promote inclusive conservation practices.

Areas of interest

A satellite baselayer map focused on the East African Rift Valley. Protected areas are displayed on the map in multicolored polygons.
Species expectations for any national, subnational, or local area on Earth
Based on the suite of spatial biodiversity data and species distributions models compiled and developed on the Map of Life platform, we can generate species expectations for any region on Earth - from a single protected area or national park to whole country. These species lists come with a variety of associated species trait and conservation status data, providing our users, like reserve managers and other conservation practitioners, with detailed information about the biodiversity within their area of interest and its importance and uniqueness within a global context.

SPecies Projections

Screenshot of a species page on MOL.org for the Pale Browed Treehunter, a bird. The left sidebar shows that the selected projection year is 2050 and the selected shared economic pathway is SSP2, and the map shows the projected habitat loss for this species under those selected variables.
Future projections of suitable species habitat
Linking our global species data to future land use change projections, we evaluate potential losses in species suitable habitats and extinction risk under different development scenarios for thousands of terrestrial vertebrate species.